Over the weekend, Alan Blinder in the New York Times and Ambrose Evans-Pritchard in the Telegraph both noted that that the real threat currently facing the U.S. economy is not inflation but deflation. One only needs to look at the large negative output gap, the dramatic collapse in nominal spending, or the declines in velocity and the money multiplier to see that there is merit to their claims. There is a real deflationary threat lingering over the U.S. economy in 2009.
With that said, there is an unfortunate irony to the current deflationary threat that can be traced back to 2003. Back then there was another deflationary threat that concerned the Federal Reserve (Fed). As a result, the Fed lowered the federal funds rate to what was at the time an historically low value of 1%. It held this short-term interest rate there for a year before gradually tightening. As we now know, this excessively-loose monetary policy was an important contributor to the buildup of the economic imbalances that eventually led to this economic crisis, including the current deflationary threat. In short, the fear of deflation in 2003 laid seeds for the deflationary threat of 2009.
What makes this an unfortunate irony is that this chain of events did not have to happen. For there was a big difference between the deflationary pressures in 2003 and the ones in 2009. In 2003 the deflationary pressures were driven by rapid productivity gains and were benign in nature. Moreover, nominal spending or aggregate demand was rapidly growing. There simply was no evidence of a malign deflationary threat as there is today and thus, there was no need for the Fed to drop interest rates so low for so long. I have documented these developments in previous posts, but here are a few key graphs that make the case. First, here is the year-on-year productivity growth rate plotted against the ex-post real federal funds rate (click on figure to enlarge):

This pictures shows that Fed was pushing the real federal funds rate into negative territory just as productivity was increasing. The next figure shows final sales to domestic purchasers, a measure of nominal spending in the United States plotted against the federal funds rate. The year 2003 is marked off by the dotted lines (click on figure to enlarge):

No indication here of a collapse in nominal spending in 2003. (There was the weak labor market in 2003, but as I have argued before the slow recovery of employment can most likely be traced to (1) the robust productivity gains and (2) the inordinate substitution of capital for labor given the low interest rates of the time.) What this all means is that the Fed's misreading of the deflationary pressures in 2003 contributed to the creation of deflationary pressures of 2009.
My hope is is that moving forward the Fed and other monetary authorities will be more careful in assessing the sources of and responding to the deflationary pressures.
With that said, there is an unfortunate irony to the current deflationary threat that can be traced back to 2003. Back then there was another deflationary threat that concerned the Federal Reserve (Fed). As a result, the Fed lowered the federal funds rate to what was at the time an historically low value of 1%. It held this short-term interest rate there for a year before gradually tightening. As we now know, this excessively-loose monetary policy was an important contributor to the buildup of the economic imbalances that eventually led to this economic crisis, including the current deflationary threat. In short, the fear of deflation in 2003 laid seeds for the deflationary threat of 2009.
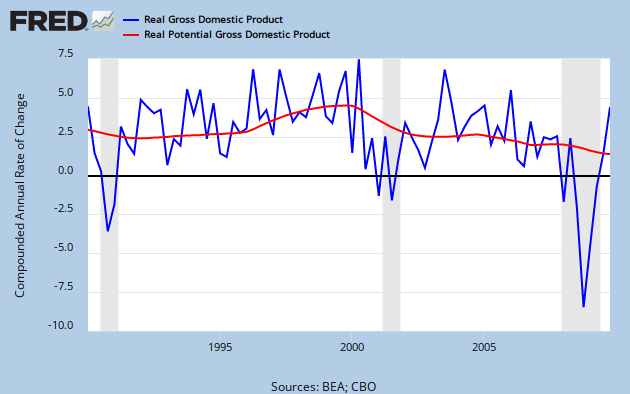
What makes this an unfortunate irony is that this chain of events did not have to happen. For there was a big difference between the deflationary pressures in 2003 and the ones in 2009. In 2003 the deflationary pressures were driven by rapid productivity gains and were benign in nature. Moreover, nominal spending or aggregate demand was rapidly growing. There simply was no evidence of a malign deflationary threat as there is today and thus, there was no need for the Fed to drop interest rates so low for so long. I have documented these developments in previous posts, but here are a few key graphs that make the case. First, here is the year-on-year productivity growth rate plotted against the ex-post real federal funds rate (click on figure to enlarge):

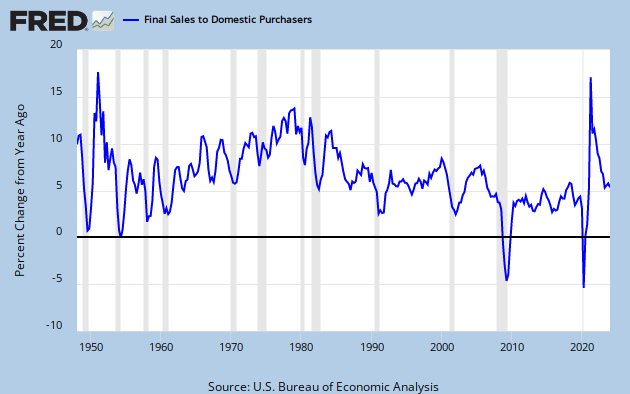
This pictures shows that Fed was pushing the real federal funds rate into negative territory just as productivity was increasing. The next figure shows final sales to domestic purchasers, a measure of nominal spending in the United States plotted against the federal funds rate. The year 2003 is marked off by the dotted lines (click on figure to enlarge):

No indication here of a collapse in nominal spending in 2003. (There was the weak labor market in 2003, but as I have argued before the slow recovery of employment can most likely be traced to (1) the robust productivity gains and (2) the inordinate substitution of capital for labor given the low interest rates of the time.) What this all means is that the Fed's misreading of the deflationary pressures in 2003 contributed to the creation of deflationary pressures of 2009.
My hope is is that moving forward the Fed and other monetary authorities will be more careful in assessing the sources of and responding to the deflationary pressures.


0 comments:
Post a Comment